Ett nytt verktyg från Google ger dig möjligheten att analysera och få rekommendationer för att förbättra olika aspekter av din webbplats, inklusive prestanda, sökmotoroptimering (SEO), säkerhet, bästa metoder och tillgänglighet.
Google har nyligen lanserat Lighthouse, ett verktyg med öppen källkod som låter dig granska din webbplats både manuellt och automatiskt.
Vilka mått analyseras av Google Lighthouse?
Verktyget granskar över 75 olika mått och ger dig en total poäng. Nedan listas några av de populäraste mätpunkterna, som är relevanta för webbplatsägare, SEO-analytiker och webbansvariga:
- Prestanda: Laddningstid till interaktivt läge, latens, hastighetsindex, resursoptimering, TTFB (Time To First Byte), hantering av tillgångar, skriptkörtid och DOM-storlek med mera.
- SEO: Mobilvänlighet, meta-taggar, indexering, användning av kanoniska länkar och strukturerad data.
- Bästa praxis: Bildoptimering, JavaScript-bibliotek, webbläsarfelloggning, användning av HTTPS, kända sårbarheter i JavaScript och liknande.
- Tillgänglighet: Sidelement, språkanvändning, ARIA-attribut och andra tillgänglighetsaspekter.
- PWA (Progressive Web Application): Omdirigering från HTTP till HTTPS, korrekt svarskod, snabb laddning på 3G-nätverk, konfiguration av startskärm och viewport med mera.
Detta är ett mycket användbart verktyg som kan användas på flera olika sätt.
Utvecklare kan till exempel använda Node.js för att köra tester programmatiskt. Det finns också ett antal verktyg på marknaden som bygger på Lighthouse och erbjuder kontinuerlig övervakning av webbplatsens prestanda.
Låt oss titta på hur du kan köra Lighthouse-tester på din webbplats.
Vi börjar med det enklaste sättet.
Mät via web.dev
Google lanserade web.dev för ett tag sedan, och det har snabbt blivit populärt. Att testa din webbplats online är enkelt.
Gå till Mät-sidan och ange webbadressen till din webbplats för att köra analysen. Resultatet genereras inom några sekunder, och du får en detaljerad rapport med total poäng.
Rapporten visar både vilka tester som godkänts och vilka områden som behöver förbättras.
Det är inte nödvändigt att sträva efter att få 100 poäng. Inte ens Googles egna webbplatser uppnår det. Se resultaten som en vägledning och försök att förbättra din webbplats så mycket som möjligt.
Observera att web.dev utför testerna med en mobil enhet som utgångspunkt. I dagsläget finns inget alternativ för att testa med en dator.
Chrome
Visste du att Lighthouse är inbyggt i din Chrome-webbläsare? Du kan välja att testa med både mobil och dator. Du hittar verktyget i utvecklarverktygen.
- Öppna Chrome-webbläsaren.
- Gå till webbplatsen du vill testa.
- Öppna utvecklarverktygen (tryck på F12 på Windows) eller högerklicka på sidan och välj ”Inspektera”.
- Gå till fliken ”Revisioner”.
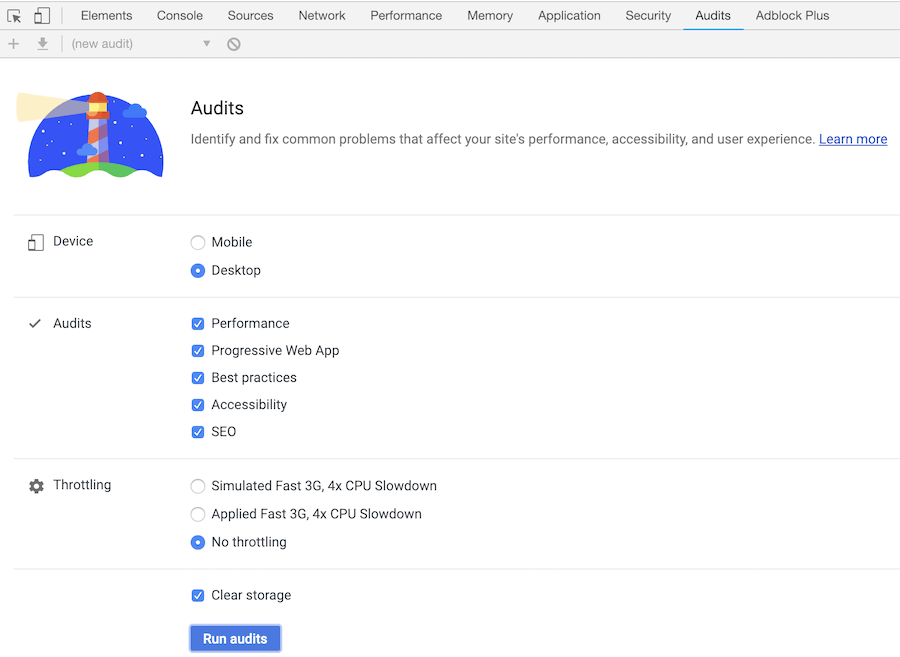
Som du ser har du möjlighet att välja vilka tester du vill genomföra. Detta är praktiskt för att fokusera på dina mål och få snabbare resultat.
Rapporten som genereras i Chrome liknar den från web.dev.
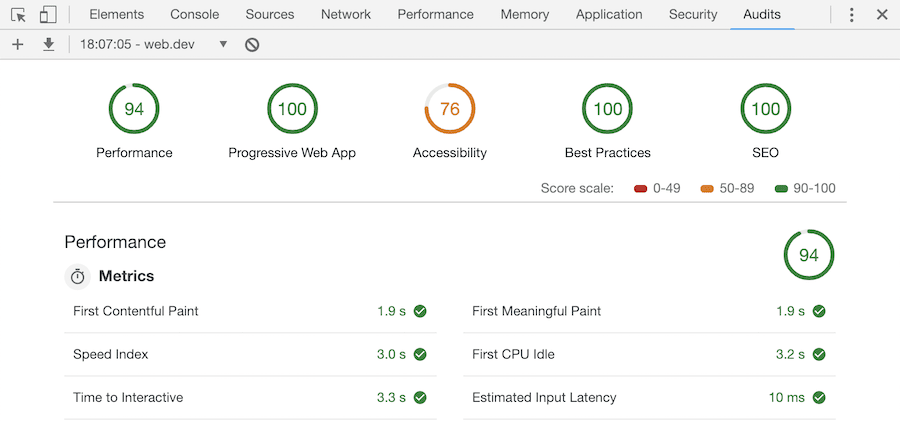
Om du tittar närmare ser du att det finns ytterligare en mätgrupp här: Progressive Web App. Detta är ytterligare en anledning till att använda Chrome för testerna.
adminvista.com Lighthouse API
Du kan också få data om webbplatsens prestanda genom adminvista.com Lighthouse API. Detta extraherar Lighthouse-statistik för både mobil och dator med ett enkelt klick och levererar resultaten i HTML-, JSON- eller CSV-format.
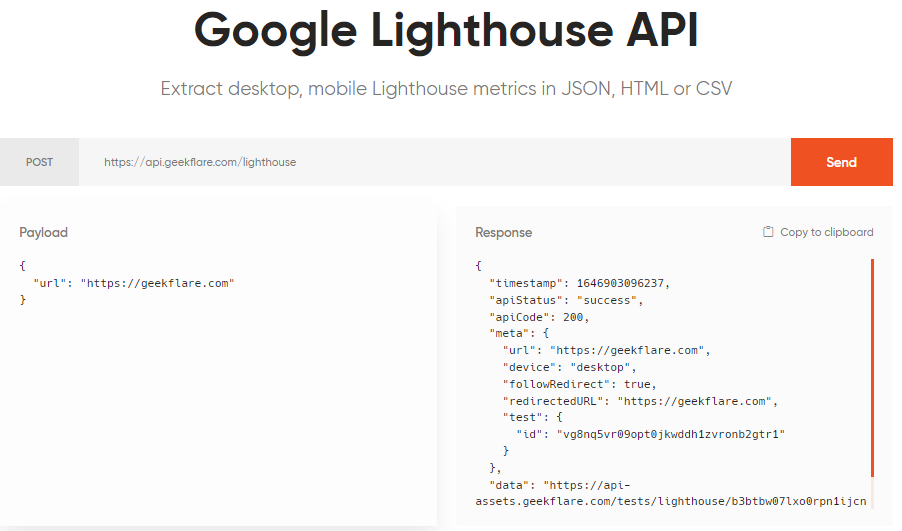
Du kan anpassa rapporten genom att ändra utdataformatet eller fokusera på specifika områden, som till exempel SEO.
{
  "parameters": [
      "--output=html",
      "--only-categories=seo",
  ],
  "url": "example.com"
}
Det finns en gratisnivå med 3000 API-anrop per månad. Betalda planer ger stöd för flera platser, proxy för bostäder och högre anropsfrekvenser, med priser som börjar från $5 per månad.
Node.js
Lighthouse är också tillgängligt som en Node.js-modul. Du kan installera den på din server och använda den programmatiskt eller via kommandoraden. Låt oss se hur du installerar Lighthouse för att köra några tester.
Installera Lighthouse på Ubuntu 18.x
Följande instruktioner har testats på en DigitalOcean server. Lighthouse kräver Node LTS 8.9 eller senare, och det antas att du redan har detta installerat. Om inte, finns det installationsguider för Node.js.
Du behöver också en Chromium-webbläsare installerad på servern. Installationsanvisningar finns här.
Att installera Lighthouse är enkelt, precis som med andra moduler.
- Logga in på din server.
- Kör följande kommando för att installera:
npm install -g lighthouse
Flaggan -g används för att installera modulen globalt.
[email protected]:~# npm install -g lighthouse
/usr/bin/lighthouse -> /usr/lib/node_modules/lighthouse/lighthouse-cli/index.js
/usr/bin/chrome-debug -> /usr/lib/node_modules/lighthouse/lighthouse-core/scripts/manual-chrome-launcher.js

> [email protected] postinstall /usr/lib/node_modules/lighthouse/node_modules/axe-core
> node build/utils/postinstall.js

+ [email protected]
added 179 packages from 119 contributors in 10.094s
[email protected]:~#
När installationen är klar kan du köra kommandot ”lighthouse” för att kontrollera att det installerats korrekt.
[email protected]:~# lighthouse
Please provide a url

Specify --help for available options
[email protected]:~#
Bra, Lighthouse är redo att användas. Låt oss testa några alternativ.
För att köra ett test med en huvudlös webbläsare:
lighthouse URL --chrome-flags="--headless"
Du måste ange en absolut URL, inklusive HTTP eller HTTPS.
Exempel:
[email protected]:~$ lighthouse https://adminvista.com.com --chrome-flags="--headless"
  ChromeLauncher Waiting for browser. +0ms
  ChromeLauncher Waiting for browser... +1ms
  ChromeLauncher Waiting for browser..... +511ms
  ChromeLauncher Waiting for browser.....✓ +2ms
  status Connecting to browser +176ms
  status Resetting state with about:blank +24ms
  status Benchmarking machine +30ms
  status Initializing… +508ms
  status Loading page & waiting for onload Scripts, CSSUsage, Viewport, ViewportDimensions, ThemeColor, Manifest, RuntimeExceptions, ChromeConsoleMessages, ImageUsage, Accessibility, LinkElements, AnchorsWithNoRelNoopener, AppCacheManifest, Doctype, DOMStats, JSLibraries, OptimizedImages, PasswordInputsWithPreventedPaste, ResponseCompression, TagsBlockingFirstPaint, MetaDescription, FontSize, CrawlableLinks, MetaRobots, Hreflang, EmbeddedContent, Canonical, RobotsTxt +27ms
  status Retrieving in-page: Scripts +2s
  status Retrieving in-page: CSSUsage +0ms
  status Retrieving in-page: Viewport +0ms
  status Retrieving in-page: ViewportDimensions +0ms
  status Retrieving in-page: ThemeColor +0ms
  status Retrieving in-page: Manifest +0ms
  status Retrieving in-page: RuntimeExceptions +0ms
  status Retrieving in-page: ChromeConsoleMessages +0ms
  status Retrieving in-page: ImageUsage +0ms
  status Retrieving in-page: Accessibility +0ms
  status Retrieving in-page: LinkElements +0ms
  status Retrieving in-page: AnchorsWithNoRelNoopener +1ms
  status Retrieving in-page: AppCacheManifest +0ms
  status Retrieving in-page: Doctype +0ms
  status Retrieving in-page: DOMStats +0ms
  status Retrieving in-page: JSLibraries +0ms
  status Retrieving in-page: OptimizedImages +0ms
  status Retrieving in-page: PasswordInputsWithPreventedPaste +0ms
  status Retrieving in-page: ResponseCompression +0ms
  status Retrieving in-page: TagsBlockingFirstPaint +0ms
  status Retrieving in-page: MetaDescription +0ms
  status Retrieving in-page: FontSize +0ms
  status Retrieving in-page: CrawlableLinks +0ms
  status Retrieving in-page: MetaRobots +0ms
  status Retrieving in-page: Hreflang +0ms
  status Retrieving in-page: EmbeddedContent +0ms
  status Retrieving in-page: Canonical +0ms
  status Retrieving in-page: RobotsTxt +0ms
  status Retrieving trace +1ms
  status Retrieving devtoolsLog & network records +110ms
  status Retrieving: Scripts +27ms
  status Retrieving: CSSUsage +53ms
  status Retrieving: Viewport +192ms
  status Retrieving: ViewportDimensions +5ms
  status Retrieving: ThemeColor +13ms
  status Retrieving: Manifest +2ms
  status Retrieving: RuntimeExceptions +295ms
  status Retrieving: ChromeConsoleMessages +1ms
  status Retrieving: ImageUsage +2ms
  status Retrieving: Accessibility +22ms
  status Retrieving: LinkElements +526ms
  status Retrieving: AnchorsWithNoRelNoopener +10ms
  status Retrieving: AppCacheManifest +6ms
  status Retrieving: Doctype +20ms
  status Retrieving: DOMStats +4ms
  status Retrieving: JSLibraries +50ms
  status Retrieving: OptimizedImages +25ms
  status Retrieving: PasswordInputsWithPreventedPaste +234ms
  status Retrieving: ResponseCompression +3ms
  status Retrieving: TagsBlockingFirstPaint +7ms
  status Retrieving: MetaDescription +6ms
  status Retrieving: FontSize +7ms
  status Retrieving: CrawlableLinks +245ms
  status Retrieving: MetaRobots +6ms
  status Retrieving: Hreflang +2ms
  status Retrieving: EmbeddedContent +2ms
  status Retrieving: Canonical +3ms
  status Retrieving: RobotsTxt +6ms
  status Resetting state with about:blank +19ms
  status Loading page & waiting for onload ServiceWorker, Offline, StartUrl +24ms
  status Retrieving in-page: ServiceWorker +59ms
  status Retrieving in-page: Offline +0ms
  status Retrieving in-page: StartUrl +1ms
  status Retrieving devtoolsLog & network records +0ms
  status Retrieving: ServiceWorker +2ms
  status Retrieving: Offline +1ms
  status Retrieving: StartUrl +1ms
  status Resetting state with about:blank +5ms
  status Loading page & waiting for onload HTTPRedirect, HTMLWithoutJavaScript +48ms
  status Retrieving in-page: HTTPRedirect +260ms
  status Retrieving in-page: HTMLWithoutJavaScript +0ms
  status Retrieving devtoolsLog & network records +0ms
  status Retrieving: HTTPRedirect +7ms
  status Retrieving: HTMLWithoutJavaScript +12ms
  status Disconnecting from browser... +7ms
  status Analyzing and running audits... +6ms
  status Evaluating: Uses HTTPS +3ms
  status Evaluating: Redirects HTTP traffic to HTTPS +24ms
  status Evaluating: Registers a service worker that controls page and start_url +1ms
  status Evaluating: Current page responds with a 200 when offline +0ms
  status Evaluating: Has a `<meta name="viewport">` tag with `width` or `initial-scale` +1ms
  status Evaluating: Contains some content when JavaScript is not available +1ms
  status Evaluating: First Contentful Paint +6ms
  status Evaluating: First Meaningful Paint +54ms
  status Evaluating: Page load is fast enough on mobile networks +10ms
  status Evaluating: Speed Index +33ms
  status Evaluating: Screenshot Thumbnails +529ms
  status Evaluating: Final Screenshot +287ms
  status Evaluating: Estimated Input Latency +2ms
  status Evaluating: No browser errors logged to the console +16ms
  status Evaluating: Server response times are low (TTFB) +1ms
  status Evaluating: First CPU Idle +1ms
  status Evaluating: Time to Interactive +30ms
  status Evaluating: User Timing marks and measures +0ms
  status Evaluating: Minimize Critical Requests Depth +2ms
  status Evaluating: Avoid multiple page redirects +3ms
  status Evaluating: Web app manifest meets the installability requirements +2ms
  status Evaluating: Configured for a custom splash screen +1ms
  status Evaluating: Sets an address-bar theme color +0ms
  status Evaluating: Content is sized correctly for the viewport +1ms
  status Evaluating: Displays images with correct aspect ratio +0ms
  status Evaluating: Avoids deprecated APIs +1ms
  status Evaluating: Minimizes main-thread work +0ms
  status Evaluating: JavaScript execution time +11ms
  status Evaluating: Preload key requests +3ms
  status Evaluating: Preconnect to required origins +2ms
  status Evaluating: All text remains visible during webfont loads +2ms
  status Evaluating: Network Requests +1ms
  status Evaluating: Metrics +2ms
  status Evaluating: start_url responds with a 200 when offline +1ms
  status Evaluating: Site works cross-browser +1ms
  status Evaluating: Page transitions don't feel like they block on the network +0ms
  status Evaluating: Each page has a URL +0ms
  status Evaluating: `[aria-*]` attributes match their roles +1ms
  status Evaluating: `[role]`s have all required `[aria-*]` attributes +1ms
  status Evaluating: Elements with `[role]` that require specific children `[role]`s, are present +0ms
  status Evaluating: `[role]`s are contained by their required parent element +1ms
  status Evaluating: `[role]` values are valid +1ms
  status Evaluating: `[aria-*]` attributes have valid values +0ms
  status Evaluating: `[aria-*]` attributes are valid and not misspelled +1ms
  status Evaluating: `<audio>` elements contain a `<track>` element with `[kind="captions"]` +1ms
  status Evaluating: Buttons have an accessible name +1ms
  status Evaluating: The page contains a heading, skip link, or landmark region +1ms
  status Evaluating: Background and foreground colors have a sufficient contrast ratio +1ms
  status Evaluating: `<dl>`'s contain only properly-ordered `<dt>` and `<dd>` groups, `<script>` or `<template>` elements. +1ms
  status Evaluating: Definition list items are wrapped in `<dl>` elements +0ms
  status Evaluating: Document has a `<title>` element +1ms
  status Evaluating: `[id]` attributes on the page are unique +1ms
  status Evaluating: `<frame>` or `<iframe>` elements have a title +1ms
  status Evaluating: `<html>` element has a `[lang]` attribute +0ms
  status Evaluating: `<html>` element has a valid value for its `[lang]` attribute +1ms
  status Evaluating: Image elements have `[alt]` attributes +1ms
  status Evaluating: `<input type="image">` elements have `[alt]` text +1ms
  status Evaluating: Form elements have associated labels +0ms
  status Evaluating: Presentational `<table>` elements avoid using `<th>`, `<caption>` or the `[summary]` attribute. +1ms
  status Evaluating: Links have a discernible name +1ms
  status Evaluating: Lists contain only `<li>` elements and script supporting elements (`<script>` and `<template>`). +1ms
  status Evaluating: List items (`<li>`) are contained within `<ul>` or `<ol>` parent elements +1ms
  status Evaluating: The document does not use `<meta http-equiv="refresh">` +0ms
  status Evaluating: `[user-scalable="no"]` is not used in the `<meta name="viewport">` element and the `[maximum-scale]` attribute is not less than 5. +1ms
  status Evaluating: `<object>` elements have `[alt]` text +1ms
  status Evaluating: No element has a `[tabindex]` value greater than 0 +1ms
  status Evaluating: Cells in a `<table>` element that use the `[headers]` attribute only refer to other cells of that same table. +1ms
  status Evaluating: `<th>` elements and elements with `[role="columnheader"/"rowheader"]` have data cells they describe. +0ms
  status Evaluating: `[lang]` attributes have a valid value +1ms
  status Evaluating: `<video>` elements contain a `<track>` element with `[kind="captions"]` +1ms
  status Evaluating: `<video>` elements contain a `<track>` element with `[kind="description"]` +1ms
  status Evaluating: `[accesskey]` values are unique +1ms
  status Evaluating: Custom controls have associated labels +0ms
  status Evaluating: Custom controls have ARIA roles +1ms
  status Evaluating: User focus is not accidentally trapped in a region +0ms
  status Evaluating: Interactive controls are keyboard focusable +0ms
  status Evaluating: Headings don't skip levels +0ms
  status Evaluating: Interactive elements indicate their purpose and state +1ms
  status Evaluating: The page has a logical tab order +0ms
  status Evaluating: The user's focus is directed to new content added to the page +1ms
  status Evaluating: Offscreen content is hidden from assistive technology +0ms
  status Evaluating: HTML5 landmark elements are used to improve navigation +0ms
  status Evaluating: Visual order on the page follows DOM order +0ms
  status Evaluating: Uses efficient cache policy on static assets +1ms
  status Evaluating: Avoids enormous network payloads +3ms
  status Evaluating: Defer offscreen images +1ms
  status Evaluating: Eliminate render-blocking resources +12ms
  status Evaluating: Minify CSS +28ms
  status Evaluating: Minify JavaScript +64ms
  status Evaluating: Defer unused CSS +69ms
  status Evaluating: Serve images in next-gen formats +12ms
  status Evaluating: Efficiently encode images +11ms
  status Evaluating: Enable text compression +6ms
  status Evaluating: Properly size images +6ms
  status Evaluating: Use video formats for animated content +7ms
  status Evaluating: Avoids Application Cache +11ms
  status Evaluating: Page has the HTML doctype +0ms
  status Evaluating: Avoids an excessive DOM size +1ms
  status Evaluating: Links to cross-origin destinations are safe +2ms
  status Evaluating: Avoids requesting the geolocation permission on page load +1ms
  status Evaluating: Avoids `document.write()` +0ms
  status Evaluating: Avoids front-end JavaScript libraries with known security vulnerabilities +0ms
  status Evaluating: Detected JavaScript libraries +9ms
  status Evaluating: Avoids requesting the notification permission on page load +1ms
  status Evaluating: Allows users to paste into password fields +0ms
  status Evaluating: Uses HTTP/2 for its own resources +0ms
  status Evaluating: Uses passive listeners to improve scrolling performance +1ms
  status Evaluating: Document has a meta description +0ms
  status Evaluating: Page has successful HTTP status code +1ms
  status Evaluating: Document uses legible font sizes +5ms
  status Evaluating: Links have descriptive text +1ms
  status Evaluating: Page isn’t blocked from indexing +1ms
  status Evaluating: robots.txt is valid +2ms
  status Evaluating: Document has a valid `hreflang` +1ms
  status Evaluating: Document avoids plugins +1ms
  status Evaluating: Document has a valid `rel=canonical` +0ms
  status Evaluating: Page is mobile friendly +1ms
  status Evaluating: Structured data is valid +0ms
  status Generating results... +0ms
  ChromeLauncher Killing Chrome instance 7098 +59ms
  Printer html output written to /home/chandan/adminvista.com.com_2019-01-20_19-29-35.report.html +46ms
  CLI Protip: Run lighthouse with `--view` to immediately open the HTML report in your browser +1ms
I den näst sista raden ser du sökvägen till rapporten. Som standard skapas en HTML-rapport, som du kan ladda ner eller visa via en webbserver.
Men vad gör du om du behöver en rapport i JSON-format?
Det kan du göra så här:
lighthouse URL --chrome-flags="--headless" --output json --output-path URL.json
Genom att använda Lighthouse CLI har du full kontroll över hur du vill använda verktyget. Det rekommenderas att du utforskar GitHub-förrådet för att lära dig mer om att använda CLI eller programmatiskt.
Slutsats
Google Lighthouse är ett lovande verktyg för att genomföra kontinuerliga tester och förbättra webbplatsens prestanda och användbarhet. Om du använder WordPress och vill få din webbplats att ladda snabbare, kan du kolla in Rocket.